Research Paper
The tropical biodiversity data gap: addressing disparity in global monitoring
Ben Collen1*, Mala Ram1, Tara Zamin1 and Louise McRae1
1Institute of Zoology, Zoological Society of London, Regent's Park, London NW1 4RY, UK; *corresponding author [email protected] t:+44(0)207 449 6642
Abstract
Nations around the world are required to measure their progress towards key biodiversity goals. One important example of this, the Convention on Biological Diversity's 2010 target, is soon approaching. The target set is to significantly reduce the rate of biodiversity loss by the year 2010. However, to what extent are the data, especially for tropical countries, available to indicate biodiversity change and to what extent is current knowledge of biodiversity change truly a global picture? While species richness is greatest in the tropics, biodiversity data richness is skewed towards the poles. This not only provides a significant challenge for global indicators to accurately represent biodiversity, but also for individual countries that are responsible under such legislation for measuring their own impact on biodiversity. We examine the coverage of biodiversity data using four global biodiversity datasets, and look at how effective current efforts are at addressing this discrepancy, and what countries might be able to do in time for 2010 and beyond. We conclude by suggesting a number of activities which might provide impetus for improved biodiversity monitoring in tropical nations.
Keywords: biodiversity monitoring; threatened species; population decline; Convention on Biological Diversity; indicators for 2010 Target
Résumé
Toutes les nations sont tenues de mesurer les progrès réalisés au regard des législations clés sur la biodiversité. Un exemple important de ceci, à savoir l'atteinte des objectifs de 2010 définis par la Convention sur la Diversité Biologique, approche à grands pas. Cependant, dans quelles mesures les données collectées, particulièrement pour les pays tropicaux, sont-elles suffisantes pour indiquer des changements de la biodiversité, et dans quelles mesures la connaissance actuelle des changements de la biodiversité donne-t-elle une vision globale des changements en cours? Bien que la richesse spécifique soit plus importante sous les tropiques, les données collectées quand au nombre d'espèces présentes sont plus importantes vers les pôles. Ceci représente non seulement un défi majeur en terme de production d'indicateurs globaux capables de représenter avec précision la diversité biologique, mais également un défi majeur pour les pays ayant la responsabilité de mesurer leur impact sur la biodiversité, et ceci en vertu des législations précédemment citées. Nous avons examiné la couverture spatiale des données sur la biodiversité au moyen de quatre jeux de données sur la biodiversité mondiale, et exploré si les efforts actuels visant à remédier à cette incohérence sont efficaces. Nous avons également identifié les pays qui pourraient être en mesure de mesurer leur impact sur la biodiversité à temps pour 2010, et au-delà. Nous concluons cette étude en suggérant un certain nombre d'activités qui pourraient améliorer le suivi de la biodiversité dans les pays tropicaux.
Mots clés: suivi de la biodiversité; espèces menacées; déclin des populations; Convention sur la Diversité Biologique; indicateurs pour 2010
|
Received: 15 January 2008, Accepted: 2 April, 2008, Published: 9 June, 2008
Copyright: © 2008 Collen et al. This is an open access paper. We use the Creative Commons Attribution 3.0 license http://creativecommons.org/licenses/by/3.0/us/ - The license permits any user to download, print out, extract, archive, and distribute the article, so long as appropriate credit is given to the authors and source of the work. The license ensures that the published article will be as widely available as possible and that your article can be included in any scientific archive. Open Access authors retain the copyrights of their papers. Open access is a property of individual works, not necessarily journals or publishers.
Cite this paper as: Collen, B., Ram, M., Zamin, T. and McRae, L. 2008. The tropical biodiversity data gap: addressing disparity in global monitoring.Tropical Conservation Science Vol.1 (2):75-88. Available online: tropicalconservationscience.org
Introduction
While biodiversity loss is a global phenomenon, its impact may be greatest in the tropics where the majority of species are distributed. This long-recognized pattern of increasing diversity towards the tropics [1] is exemplified in tropical forests, which take up less than 2 percent of the Earth's surface, but contain upwards of 50 percent of its biodiversity. In order to effectively mitigate biodiversity loss, greater investment of conservation attention is required in tropical regions where there is the most to lose. Broad-reaching global legislation may provide an impetus for such investment. One important example is the Convention on Biological Diversity (CBD), under which the 190 signatory nations have ambitiously committed themselves to actions to "achieve, by 2010, a significant reduction of the current rate of biodiversity loss at the global, regional and national levels [2]." Assessing progress towards this important goal requires data on the status and trends in biodiversity for a given country or region. Are nations, particularly those in the species-rich tropics, adequately prepared for this?
Measuring current trends and predicting future changes in the health of species and ecosystems have long been goals of conservation science; however, the adoption of the 2010 target has highlighted the need for investment in such tools [3]. A range of indicators of biodiversity change at the national, regional, and global level are required to inform policy-makers on their progress towards this goal [2,3]. However, since these indicators are only as robust as the data on which they are based, the lack of baseline information for many regions presents a major barrier to the efficacy of these measures.
One of the key recommendations for development of biodiversity indicators is that data gaps be identified and addressed [4,5], yet progress towards this has been slow, and few authors have explicitly tackled the issue of data availability in the tropics. In order to assess current biodiversity data coverage and identify areas in need of research investment, we use four key global datasets, each of species data. We examine the geographic patterns in these data and compare them to known species richness gradients. We assess how effective, given these patterns, the current CBD biodiversity indicators may be at measuring trends. We describe ongoing efforts aimed at addressing the geographical discrepancy of data, and how effective these might be at helping countries to evaluate their progress towards the 2010 target. As this is a critical period for addressing this data disparity, we provide a number of recommendations on how this might be achieved.
Methods
We evaluated four global biodiversity datasets, which may be indicative of data availability throughout the world and which may serve to assess country-level adherence to the 2010 target using species data. These were the IUCN Red List of Threatened Species Global Amphibian dataset [6], downloaded from [7,8]; the Living Planet Index dataset [9,10]; the IUCN Regional Red List dataset, derived principally from [11] and [12]; and the Global Biodiversity Information Facility data [13]. These four datasets were chosen to reflect several types of biodiversity data, specifically global species-level conservation assessments, global population abundance trends, national species-level conservation assessments, and global species occurrence data, respectively. We did not attempt to select any particular taxa, but rather to take advantage of what was publicly available. The data assessed in this survey are not intended to be exhaustive, but rather to be indicative of the types of biodiversity information available, and those which may provide species-based measures of biodiversity change for the CBD 2010 target. Throughout the analysis, we use latitude to assess data coverage. While other, perhaps more favorable, techniques are available (e.g., true distributional data), this technique allows comparison of several datasets to each other and to existing species distribution information.
Global conservation assessment
The IUCN Red List of Threatened Species (herein "Red List") is a system used to assign species to categories reflecting relative risk of extinction, ranging from Least Concern (for widespread and abundant species under little threat), to Critically Endangered (species that are facing an extremely high risk of extinction) [14]. Assessing change in Red List status over time gives a broad measure of change in extinction risk [15,16]. Data on geographic range, population structure, and numbers, habitat, and ecology, as well as the threat processes impacting species, are used to inform Red List assessments. In cases where there are insufficient data on a given species "to make a direct, or indirect, assessment of its risk of extinction based on its distribution and/or population status" [14], the category of Data Deficient (DD) is assigned, requiring further information before the conservation status of the species can be determined. Determining where DD species are distributed is therefore indicative of the areas of the world which lack important biological and environmental information.
Twenty-three percent of amphibian species are classified by IUCN as DD [6] compared, for example, to 1 percent of the more data rich birds [17]. As the geographic distribution of each amphibian species has been mapped and made publicly available [8], we selected this taxonomic group for the analysis. We derived the geometric center of distribution for each amphibian, and then calculated the number of DD species within each 10-degree latitudinal band. The proportion of DD species with respect to the number of species distributed in each band was calculated, in order to control for the latitudinal gradient in species richness.
Population trends
Change in species abundance over time represents a sensitive means of assessing the status of biodiversity over the short to medium term [18,19]. We used the Living Planet Index (LPI) database [9,10] to gather time series information for species, collated from published scientific literature, databases (e.g., the Global Population Dynamics Database [20] and European birds [21]), and gray literature. To be included, time series had to meet a number of criteria:
- A measure of population size was available for at least two years;
- Information was available on how data were collected, with units of measurement (e.g. number of individuals, biomass, nest counts, etc);
- The geographic location of the population was known;
- The population measure was for the same population throughout the time series, and was collected using the same method;
- The data source was referenced and traceable.
Using this dataset, we extracted the geographical location of each population time series of mammals in Neotropical and Nearctic realms, and assigned each to a latitudinal band of 10 degrees. The number of populations present in each band was recorded. This subset of the Living Planet database was selected for the analysis since it is relatively comprehensive for mammalian taxa, covering all the Americas from within the Arctic Circle southward down to Tierra del Fuego, and allowed for a comparison to be made to the New World mammalian species richness data, extracted from [22].
National level conservation assessment
National and regional level conservation assessments may help deliver information more compatible to local-level conservation planning [23] and provide one option to assess progress towards CBD targets at a national level. To determine countries with National Threatened Species Lists (NTSLs), we compiled information principally from [11] and [12]. These sources include a list of NTSLs by taxonomic group from all countries in existence in 1994 [12], and information from 47 countries that responded to a previous survey on NTSLs [11]. Our analysis accounted for the presence or absence of any NTSLs within a country and did not take into account differences in taxonomic coverage, as this information was not available for all regions. We conducted a brief search of the literature to add any NTSLs which had not been represented in either the above two sources. Six were found [24,25].
We mapped the distribution of countries with NTSLs, differentiating those that used the IUCN Red List Categories and Criteria from other methods of classifying threat. The geometric center of each country was then derived, giving a standardized single measure of latitude and the proportion of countries with NTSLs within each latitudinal band. While there are alternative biogeographic approaches, which might help account for the fact that certain countries have both temperate and tropical climates, the approach taken in this study allows comparison of several datasets. Biodiversity data in many datasets are at a country level, which precluded alternative types of analysis. Latitudinal bands were sectioned in 10 degrees from the Equator. The proportion of countries with NTSLs in each latitudinal band was calculated in order to control for the greater number of countries at lower latitudes. All the estimates presented are conservative, due to the low response rate of the survey conducted in [11,12].
Global records of species occurrence
The Global Biodiversity Information Facility (GBIF) was established in 2001 to enable global electronic access to primary scientific data on biodiversity. An infrastructure has been developed through which natural history collections and other institutions can publish databases to add to the shared network of biodiversity data [26]. We used the GBIF "country" search to establish the quantity of georeferenced occurrence data for the 243 countries recognised in GBIF (see [13]). Geometric centers were calculated for each country and their latitudes plotted against a count of occurrence data for each. While access to the georeferenced occurrence data points themselves would have been more indicative of the distribution of biodiversity data, we did not have the facility to compile web-scraping algorithms to download and handle the 43 million records. It was therefore decided that by investigating the number of occurrences by country, we would still be able to make a reasonable assessment of biodiversity information at the country level.
Biodiversity indicators for the CBD 2010 Target
After examining data coverage, we reviewed the current CBD indicator set [27,28] and evaluated the potential for delivery in time for 2010, with respect to national-level data for tropical countries. The CBD has identified 22 headline indicators, grouped into seven focal areas (see Appendix 1). Eight headline indicators in the CBD focal areas "Status and trends of the components of biodiversity" and "Sustainable use" were reviewed. Each headline indicator was assessed to determine the geographic coverage that it could apply to, as well as its current ability to provide adequate data for tropical countries to measure their progress toward the 2010 target.
Results
All four datasets point to a similar pattern of fewer, more scattered data available in the tropics. Along with highlighting a tropical-temperate discrepancy, this analysis also reveals great differences between data availability for the Northern and Southern Hemispheres. This general pattern in disparity in geographic coverage of each of the datasets is examined below in greater detail.
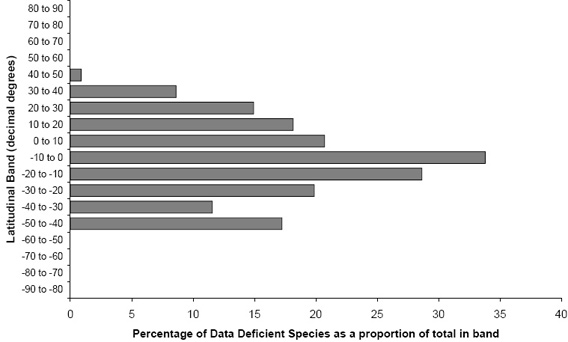
Figure 1. Latitudinal distribution of amphibians listed as Data Deficient [6], as a percentage of all amphibian species present in each 10-degree latitudinal band. Data from [7,8]
Global conservation assessment
Although amphibians are relatively well-studied and have been comprehensively assessed, data deficiency remains an issue [29]. Even after controlling for the gradient in species richness, it is evident that there are more DD amphibian species in the tropics (Fig. 1), illustrating a lack of meaningful data for these regions. The proportion of DD species south of the Equator is greater than that for the equivalent latitudinal bands north of the Equator. The only area which does not appear to strictly follow this latitudinal pattern is the band -50 to -40 degrees, which covers parts of Argentina, Chile, Tasmania, and New Zealand. There are five DD species amongst the 29 amphibians found in this latitudinal band. These five species are distributed in the Patagonian region of Chile and Argentina, which is infrequently studied due to its remoteness and the low human density.
Population trends
The subset of Nearctic and Neotropical mammalian population time series data shows clearly that data are much scarcer in the tropics, and quite minimal southwards of 25 degrees north latitude (Fig. 2). The predominance of data from temperate regions in the Northern Hemisphere is evident, similar to the pattern observed in global conservation assessment data for amphibians. When compared to total mammalian species richness for these biogeographic realms, it is clear that there is a large discrepancy in data availability, as regions with the greatest mammalian species richness (approximately 15 degrees south latitude) have very few data.
National level conservation assessment
The quantity of NTSLs produced by temperate countries outweighs that of tropical nations (Fig. 3). While 56 percent of temperate countries (defined as those whose geometric center is located north of the Tropic of Cancer and south of the Tropic of Capricorn) have NTSLs, only 26 percent of those found within the tropics have similar publications. It is also evident that the number of NTSLs for countries at high latitudes in the Northern Hemisphere is much greater in comparison with those at similar latitudes in the Southern Hemisphere. When these data are mapped (Fig. 4), it becomes apparent that the largest gap in coverage is in Africa, with only one in four countries possessing a NTSL. Other notable gaps include west Asia as well as Indonesia and Papua New Guinea.
The only deviation from the above pattern is at the latitudinal band of -30 to -20 degrees. Among the countries in this band are Australia, New Zealand, and South Africa, where there is more emphasis on biodiversity data collection and greater conservation attention given in comparison with other Southern Hemisphere countries.
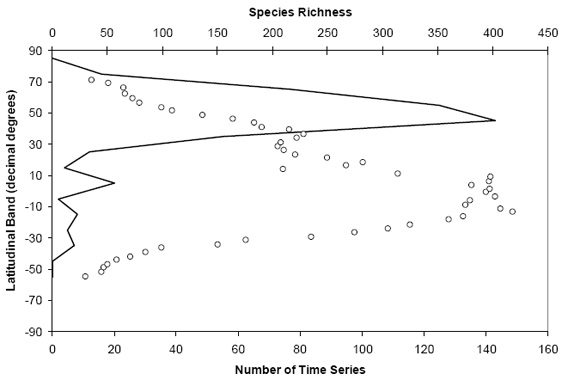
Fig. 2. Latitudinal distribution of population time series for Nearctic and Neotropical mammal species in comparison to species richness. Population time series data are shown by black line; species richness data from shown by open circles. Data from [9,10,22].
Global records of species occurrence
More than one in three georeferenced records (36 percent) contained in the GBIF database [13] are from the USA. The majority of georeferenced data (83 percent) comes from only 10 countries (in order, from the highest number of records: USA, France, Germany, Costa Rica, United Kingdom, South Africa, Canada, Norway, Austria, and the Netherlands). These records are skewed towards temperate regions, with a relatively strong peak between the Equator and 10 degrees north corresponding to the prevalence of Costa Rican data (Fig. 5). This of course is not typical for all places within that latitudinal band around the world.
Tropical country delivery of global biodiversity indicators
The lack of data on tropical biodiversity will impact the efficacy with which CBD indicators are able to accurately portray biodiversity change in tropical countries. Out of the eight CBD headline indicators that were assessed, only two appear to have sufficient coverage to deliver comprehensive progress measures for tropical countries (Appendix 2). These include "Trends in selected biomes, ecosystems, and habitats" derived from satellite data and "Trends in coverage of protected areas" from the World Database of Protected Areas. National-level coverage of biodiversity data in the remaining indicators is more varied. Certain indicators may be able to generate quite comprehensive global coverage (e.g., "Trends in abundance and distribution of selected species" and "Trends in status of threatened species"), while others are likely to be much more limited in their national level coverage (e.g., "Trends in areas under sustainable management"). Even with this range of indicators, many countries may still be faced with inadequate data to assess their own progress towards the 2010 target.
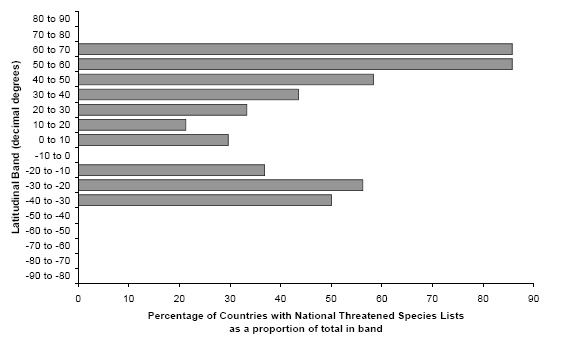
Fig. 3. Latitudinal distribution of countries with National Threatened Species Lists, as a percentage of all countries present in each 10 degree latitudinal band. Data from [11,12]
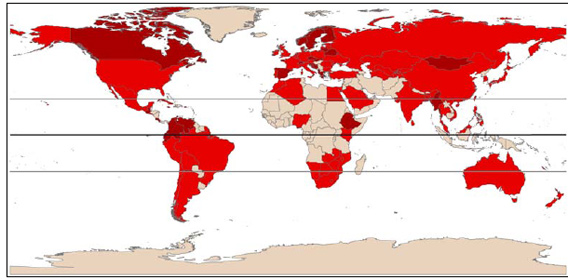
Fig. 4. Distribution of countries which have National Threatened Species Lists compiled using IUCN Categories and Criteria (dark red) or other criteria (bright red). Data from [11,12]. Tropic of Cancer, Equator, and Tropic of Capricorn are delineated on the map.
Discussion
With the adoption of global, regional, and national biodiversity targets, it is paramount that robust and meaningful data on biodiversity trends are generated. If changes in biodiversity cannot be measured accurately, the threatening processes that are impacting species and ecosystems, particularly those that are driven by human activities, cannot be adequately addressed. It is worrying that, in many cases, coverage of biodiversity data appears to correlate negatively with species richness. While many monitoring programs are well- established in temperate regions, long-term monitoring schemes of tropical biodiversity are still few and far between. This may severely impact the ability of tropical nations to make meaningful conclusions about rates of biodiversity change within national borders. Along with geographic bias in data, there are taxonomic biases which may influence the ability to assess changes to biodiversity. While we have not explicitly evaluated taxonomic coverage of the datasets here, we can comment briefly on taxonomic coverage of biodiversity data. Key omissions from most biodiversity datasets are many plants, most invertebrates, and all microbes [3,7,30]—groups that probably have the greatest importance to the sustained delivery of ecosystem services [30], in particular those from tropical regions. At this point in time, biodiversity datasets are still far from being a comprehensive global resource in all countries, and consequently the effectiveness with which global biodiversity change can be measured, is compromised.
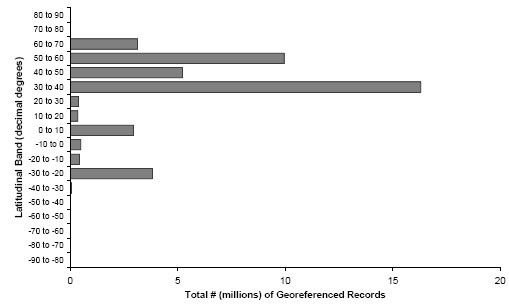
Fig. 5. Latitudinal distribution of georeferenced records from GBIF [13]. Data are derived from country geographic centroids and totals by country, therefore are reflective of national level data, and not necessarily species distribution.
Among the many reasons for the difference in data availability between tropical and temperate regions, significant obstacles include insufficient funding, lack of adequate infrastructure and expertise for data collection, inaccessibility to research sites due to political upheaval, and difficulties in getting data published or made public. As these issues are not easily overcome in the short term, they are unlikely to be resolved with enough time to impact data coverage by 2010.
Implications for conservation
Despite shortfalls in the existing knowledge of biodiversity, it is still possible to observe meaningful trends. There is overwhelming evidence that the changes witnessed over recent years are substantial and predominantly negative [7], and that these effects are being felt most acutely in the tropics [7,10,31,32], where the majority of biodiversity exists. Forest cover in the tropics continues to decline sharply, estimated at an annual loss of 0.8 percent for all tropical forests, with particularly severe losses in Southeast Asia [30,32]. Even though current data permits observation of such trends, it is still necessary to increase data coverage in order to make these measurements more robust.
The tropical biodiversity data gap may influence certain CBD indicators more than others. The variety of methods and scales of CBD indicators will help to minimize data gaps; nonetheless, these indicators are limited by both quality and quantity of data. Our review indicates that other than subsets of certain indicators (e.g., birds in IUCN Red List Index [31]), the indicators most likely to deliver nearly complete information for both tropical and temperate regions in time for 2010 are the satellite-based approaches. These approaches may be particularly useful in assessing certain systems, such as changes in forest cover. However, they may be less applicable to other systems, are relatively coarse in what they can measure, and can have trade-offs in the utility of the data produced (e.g., see [33]). The non-satellite indicators, however, are primarily reliant on pre-existing available data, which are most lacking in tropical latitudes. In order to rectify these issues, steps are being taken to minimize the impact of discrepancies in sampling and data coverage. These include using different methods of aggregation [10], working to bring in more data (e.g., Birdlife International's Globally Threatened Birds Forum [34]), and increasing the coverage of lesser known groups (e.g., the IUCN Red List Index sampled approach, which assesses invertebrate and plant taxa [16,35]). A great deal of information in tropical nations exists in the form of theses and technical reports. Working with local scientists is the best way to access these untapped sources of data. Nonetheless, there is no substitute for informed indicator design with more representative and better quality data [5].
A focus for future research
Assessing the global distribution of biodiversity data gives a focus for future development. There are key areas where effective solutions may be found. We suggest that the following activities would provide impetus to address the tropical biodiversity data gap:
· Developing methods that use representative samples and/or weighting approaches to make the best of current data;
· Filling existing gaps by focusing research and monitoring on key regions, habitats, and taxa;
· Investment in local institutions that can develop the infrastructure and expertise for long-term monitoring; all of which can combine to establish . . .
· A global biodiversity observation system, which is systematically designed across regions and taxa.
Collaborative approaches between indicator development groups and, on the ground, conservation organizations might provide a useful impetus to start meaningful data collection in areas where there are gaps. For example, a new initiative based upon camera trapping, the Wildlife Picture Index project, aims to evaluate trends in abundance of vertebrate species in wilderness areas by making use of existing camera trap sites and adding to this starting set [36]. Camera traps are ideal for monitoring medium to large mammals in particular, and with advancing technology and falling costs, might make a good addition to tropical systems monitoring. However, this clearly does not address some of the taxonomic issues referred to above.
Solutions such as web-enabled valid taxon name databases, as described in [37], where collecting occurrence data, through initiatives such as GBIF, might be one way of enhancing biodiversity data coverage. Initiatives such as the American Museum of Natural History SPIDA project [38] remove observer bias and account for lack of taxonomic expertise, which can be particularly problematic in the less well studied groups of organisms that make up the majority of biodiversity. These programs have the potential to greatly increase tropical biodiversity data, if given enough specimens. A standardized bio-monitoring system (e.g., [39]), might increase data coverage by requesting the collection of standardized baseline information across countries. The key to this approach is not only to encourage national-level sign-up to such standards, but subsequently to provide the facility to fundraise so that monitoring systems may be put in place and maintained. Although the cost of running such programs may vary by several orders of magnitude among taxa and countries [40], surrogates may provide a shortcut to useful biodiversity data (e.g., [41,42]). Further, appropriately designed sampling schemes may lessen the required coverage if implemented accurately [35].
Although there is a clear discrepancy in biodiversity data coverage, which may impact the ability of countries to report on the CBD 2010 target, many programs are working to minimize this gap. The global and regional coverage of conservation assessments is continually expanding, leading to better geographic and taxonomic representativeness in indicators such as the IUCN Red List Index, which can in some cases be carried out at the sub-global level (e.g. [43]). Population-based indicators such as the Living Planet Index, with more sensitive means of measuring change at the cost of breadth of taxonomic coverage, are able to explore different aggregations to minimize the impact of gaps. Lastly, initiatives such as GBIF, which aim to mobilize pre-existing data for tropical regions, are experiencing notable success. These data may well begin to feed into the existing set of global biodiversity indicators, or may yet generate separate indicators of their own.
The potential to catalogue, map, and evaluate biodiversity has been revolutionized by advances in computing, technology, and, more recently, internet-based data-sharing portals. The process of information gathering is perhaps more cumulative than ever before [44]. In spite of all the effort going into biodiversity data collection, country-level reporting for the 2010 target is likely to be highly variable. The year 2010 is impossibly close; but the decisions made in the following few years will dictate what tropical countries can hope to achieve in time for new target timelines beyond 2010.
Acknowledgments
We thank Jonathan Loh for access to data and for comments on the structure and content of this article, and two anonymous reviewers for their insights which have greatly improved the paper. BC and TZ were funded by the Rufford Maurice Laing Foundation, LM by WWF International, and MR by the Esmée Fairbairn Foundation.
References
[1] Hawkins, B. A. 2001. Ecology's oldest pattern? Trends in Ecology & Evolution 16: 470
[2] UNEP. 2002. Report on the sixth meeting of the Conference of the Parties to the Convention on Biological Diversity (UNEP/CBD/COP/20/Part 2) Strategic Plan Decision VI/26, Convention on Biological Diversity.
[3] Balmford, A., Bennun, L., ten Brink, B., Cooper, D., Cote, I.M., et al. 2005. The Convention on Biological Diversity's 2010 target. Science 307: 212-213
[4] Balmford, A., Crane, P., Dobson, A., Green, R.E., and Mace, G.M. 2005. The 2010 challenge: data availability, information needs and extraterrestrial insights. Philosophical Transactions of the Royal Society of London B 360: 221-228
[5] Mace, G.M., and Baillie, J.E.M. 2007. The 2010 Biodiversity Indicators: challenges for science and policy. Conservation Biology 21: 1406-1413
[6] IUCN. 2007. 2007 IUCN Red List of Threatened Species. www.iucnredlist.org.
[7] Millennium Ecosystem Assessment. 2005. Ecosystems and human well-being: biodiversity synthesis. World Resources Institute, Washington DC, USA.
[8] NBII. 2008. World Data Centre for Biodiversity and Ecology. http://wdc.nbii.gov/ma/home.htm
[9] Collen, B., Loh, J., Holbrook, S., McRae, L., Amin, R., and Baillie, J.E.M. In review. Taking the pulse of the planet: what the living planet index can tell us by 2010.
[10] Loh, J., Green., R.E., Ricketts, T., Lamoreux, J.F., Jenkins, M., et al. 2005. The Living Planet Index: using species population time series to track trends in biodiversity. Philosophical Transactions of the Royal Society of London B 360: 289-295
[11] Miller, R.M., Rodríguez, J.P., Aniskowicz-Fowler, T., Bambaradeniya, C., Boles, R., et al. 2007. National Threatened Species Listing Based on IUCN Criteria and Regional Guidelines: Current Status and Future Perspectives. Conservation Biology 21: 684-696
[12] UNEP World Conservation Monitoring Centre. 1994. Biodiversity data source book. UNEP WCMC, Cambridge, UK. p140
[13] GBIF. 2007. Global Biodiversity Information Facility. Data downloaded 04/01/2008. http://www.gbif.org/
[14]. IUCN. 2001. IUCN Red List Categories and Criteria. Version 3.1. World Conservation Union, Gland, Switzerland
[15] Butchart, S.H.M., Akcakaya, H.R., Chanson, J.S., Baillie, J.E.M., Collen, B., et al. 2007. Improvements to the Red List Index. PLoS ONE 2: e140
[16] Butchart, S.H.M., Stattersfield, A.J., Baillie, J.E.M., Bennun, L.A., Stuart, S.N., et al. 2005. Using Red List Indices to measure progress towards the 2010 target and beyond. Philosophical Transactions of the Royal Society of London B 360: 255-268
[17] Baillie, J.E.M., Hilton-Taylor, C., Stuart, S.N. 2004. 2004 IUCN Red List of threatened species: a global species assessment. IUCN, Gland, Switzerland and Cambridge, UK.
[18] Balmford, A., Green, R.E., and Jenkins, M. 2003. Measuring the changing state of nature. Trends in Ecology & Evolution 18: 326-330
[19] Ceballos, G., and Ehrlich, P.R. 2002. Mammal population losses and the extinction crisis. Science 296: 904-907
[20] NERC Centre for Population Biology. 1999. The Global Population Dynamics Database. Imperial College London, UK
[21] Pan-European Common Bird Monitoring. 2006. European common bird index: population trends of European common birds 2005 update. EBCC — European Bird Census Council.
[22] Willig, M.R., Kaufman, D.M., and Stevens, R.D. 2003. Latitudinal gradients of biodiversity: pattern, process, scale and synthesis. Annual Review of Ecology and Systematics 34: 273-309
[23] Gardenfors, U. 2001. Classifying threatened species at national versus global levels. Trends in Ecology & Evolution 16: 511-516
[24] Clark, E.L., Munkhbat, J., Dulamtseren, S., Baillie, J.E.M., Batsaikhan, N., et al. 2006. Mongolian Red List of Mammals. Zoological Society of London, UK
[25] Golding, J.S. 2002. Southern African Plant Red Data Lists. SABONET, Pretoria, South Africa.
[26] Edwards, J.L. 2004. Research and societal benefits of the Global Biodiversity Information Facility. Bioscience 54: 485-486
[27] UNEP. 2004. Decisions Adopted by the Conference of Parties to the Convention on Biological Diversity at its Seventh Meeting (UNEP/CBD/COP/7/21/Part 2) Decision VII/30. (Convention on Biological Diversity, 2004). http://www.cbd.int/decisions/cop-07.shtml?m=COP-07&id=7767&lg=0
[28] UNEP. 2006. Decisions Adopted by the Conference of Parties to the Convention on Biological Diversity at its Eighth Meeting (UNEP/CBD/COP/8/31/Annex 1) Decision VIII/15. (Convention on Biological Diversity, 2006). http://www.cbd.int/decisions/?m=COP-08&id=11029&lg=0
[29] Stuart, S.N., Chanson, J.S., Cox, N.A., Young, B.E., Rodrigues, A.S.L., et al. 2004. Status and trends of amphibian declines and extinctions worldwide. Science 306: 1783 - 1786
[30] Balmford,. A., and Bond, W. 2005. Trends in the state of nature and their implications for human well-being. Ecology Letters 8
[31] Butchart, S.H.M., Stattersfield, A.J., Bennun, L.A., Shutes, S.M., Akçakaya, H.R., et al. 2004. Measuring global trends in the status of biodiversity: Red List Indices for birds. PLoS Biology 2: e383
[32] FAO. 2003. State of the World's Forests. Food and Agriculture Organization, Rome, Italy.
[33] Green, R.E., Balmford, A., Crane, P.R., Mace, G.M., Reynolds, J.D., et al. 2005. A framework for improved monitoring of biodiversity: responses to the World Summit on Sustainable Development. Conservation Biology 19: 56-65
[34] BirdLife International Globally threatened birds forum. http://www.birdlife.org/action/science/species/global_species_programme/gtb_forums.html
[35] Baillie, J.E.M., Collen, B., Amin, R., Akcakaya, H.R., Butchart, S.H.M., et al. in press. Towards monitoring global biodiversity. Conservation Letters.
[36] Wildlife Conservation Society. Wildlife Picture Index. http://www.wcs.org/international/globalpolicy/globalindicators
[37] Guralnick, R.P., Hill, A.W., and Lane, M. 2007. Towards a collaborative, global infrastructure for biodiversity assessment. Ecology Letters 10: 663-672
[38] American Museum of Natural History. SPIDA project. http://research.amnh.org/invertzoo/spida/common/index.htm
[39] Teder, T., Moora, M., Roosaluste, E., Zobel, K., Partel, M., et al. 2007. Monitoring of biological diversity. Conservation Biology 21: 313-317
[40] Gardner, T.A., Barlow, J., Araujo, I.S., Avila-Pires, T.C., Bonaldo, A.B., et al. 2007. The cost-effectiveness of biodiversity surveys in tropical forests. Ecology Letters 11
[41] Balmford, A., Green, M.J.B., and Murray, M.G. 1996. Using higher-taxon richness as a surrogate for species richness .1. Regional tests. Proceedings of the Royal Society of London Series B-Biological Sciences 263: 1267-1274
[42] Balmford, A., Jayasuriya, A.H.M., and Green, M.J.B. 1996. Using higher-taxon richness as a surrogate for species richness .2. Local applications. Proceedings of the Royal Society of London Series B-Biological Sciences 263: 1571-1575
[43] Quayle, J.F., Ramsay, L.R., and Fraser, D.F. 2007. Trend in the status of breeding bird fauna in British Columbia, Canada, based on the IUCN Red List Index method. Conservation Biology 21: 1241—1247
[44] Purvis, A., and Hector, A. 2000. Getting the measure of biodiversity. Nature 405: 212 - 219
|


